Alternancia onda T
T-wave Alternans
T-Wave Alternans includes the following features:
- It is believed that T-Wave Alternans is a predictor of V-Tach events.
- TWA are transient events.
- TWA events occur at heart rates from 50 bpm to 130 bpm.
- TWA events are quite recognizable from 20 micro-volts to 300 micro-volts.
- TWA events are not valid when following peak R-wave changes, which are caused by body position changes.
- TWA events should always be validated by viewing the peaks of both the R-wave and the T-wave.
- TWA events of 20 to 300 micro-volts occur in many Holter ECG recordings.
- Holter ECG is the methodology of choice for finding transient ECG events.
- The CardioScan 12 Holter system analyzes the peaks of all T-waves, and displays time periods of alternating T-wave amplitudes. Such time periods are then subjected to visual verification of the actual R-waves and T-waves, so that the physician or technician can validate the actual occurrence of TWA.
- Many studies are required to determine the diagnostic significance of detecting TWA in 1 to 7 day Holter ECG recordings. Are any TWA’s diagnostic predictors, or is there a requirement for a certain percentage of time of TWA? What is the significance in the difference among 3, 30, and 300 micro-volts of TWA? Do heart rate ranges play a role in TWA’s being diagnostic predictors? And on and on?
How Does The CardioScan 12 Detect TWA

This is a normal series of T-wave amplitudes in a 24-hour Holter ECG at 15:49.

This is a 1-hour display of all T-wave amplitudes during the 10:00 AM time period. At the top is a 24-hour trend display of T-wave amplitudes. Those 1-hour time periods with detected TWA are highlighted with a thick yellow arrow. The light blue cursor is on the 10:00 AM hour. The six rows of green vertical lines are ten minute displays of each T-wave amplitude during the 10:00 AM time period. The red time periods are successive T-wave amplitudes that are alternating in amplitude. Placing the mouse arrow on a red area will show the following display.
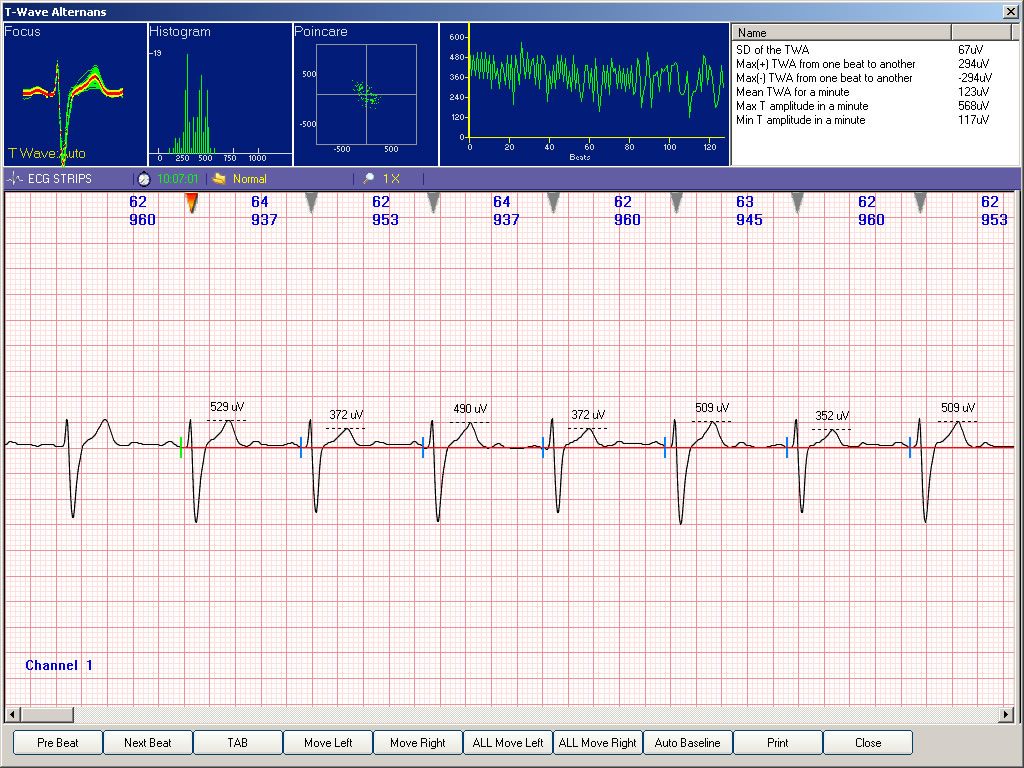
This is the resulting display when clicking the mouse in the red area. The upper left part of the display shows 128 successive normal beats superimposed on top of each other. For the T-waves, the red shows the average T-wave amplitude, and the green shows the min to max spread of T-wave amplitudes for the 128 beats. In the middle top, you see a series of vertical appearing green lines. This is a display of the same 128 beats in which the up and down green lines are tracking the amplitude of each T-wave amplitude. The mouse cursor can move to any part of these 128 beats. The below shows the validated TWA when you increase the Gain from a range of x2 to x10.

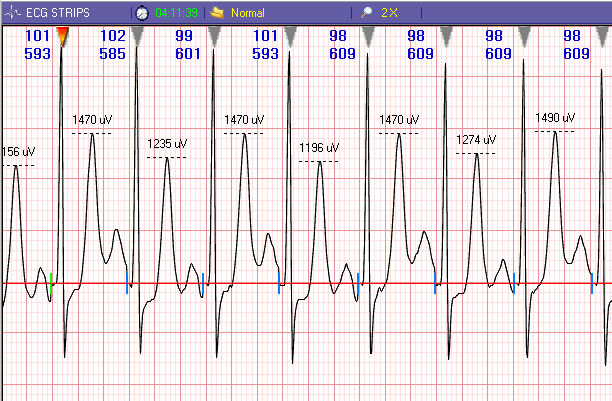
This expanded amplitude ECG gives visual validation of T-wave Alternans. The R-wave is not changing in amplitude, but the alternating T-waves are 529 to 372 to 490 to 372 to 509 to 352 to 509 micro-volts.
A subsequent mouse click on the Print icon will produce a 1-page report of TWA.
Since many studies are needed to establish diagnostic criteria for the detection of TWA in 24-hour Holter ECG recordings, optional tools are provided for detecting events of TWA. This is shown below.
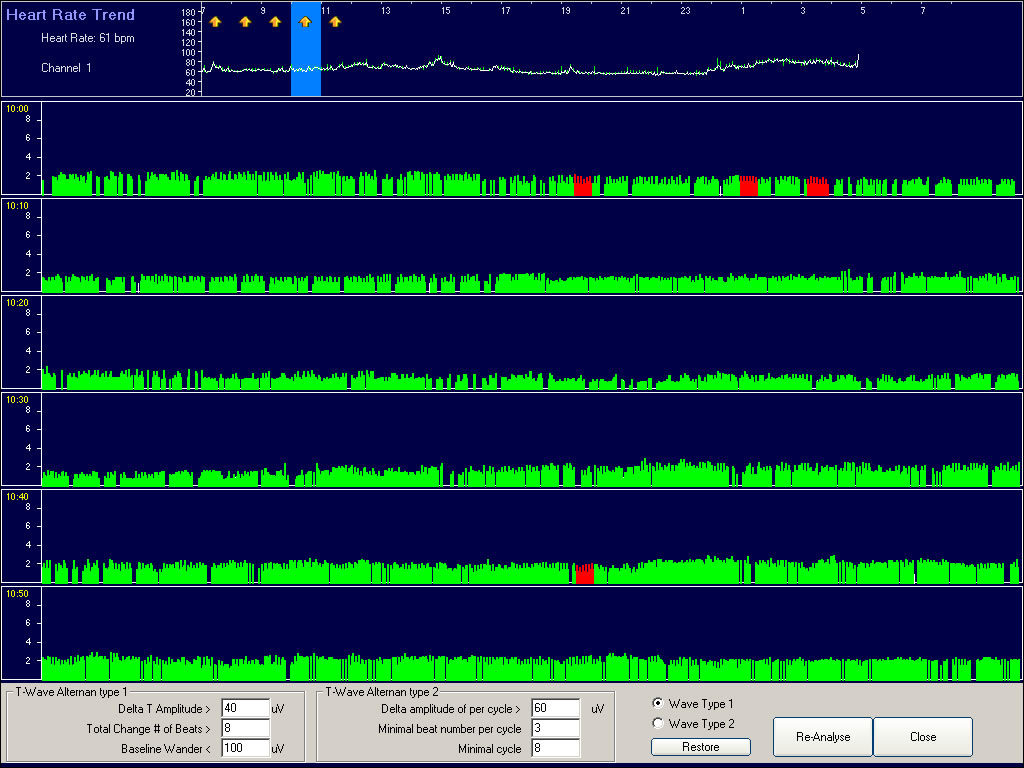
The bottom of the 1-hour T-wave amplitude display shows that the user can select different criteria for detecting TWA. You can select an amount of Delta T-wave amplitude change, you can select how many alternating beats are required, you can decide how much baseline wander will be allowed, etc. The TWA analysis applies to both 3-Lead and 12-Lead Holter ECG recordings. The “Re-Analyze” icon allows any lead to be analyzed and displayed. When a different ECG lead is selected, it only takes 10-seconds to re-analyze and display the 24-hours of T-wave amplitudes.
Important considerations in developing the Holter TWA program
- DMS does not believe that a “frequency analysis” is the proper method for determining the existence or non-existence of TWA.
- Heart Rate Variability is a good example.
- A review of the DMS program for HRV shows the high sophistication of the DMS programs for Time Domain and Frequency analysis and reports.
- There are thousands of studies reporting on the value of HRV.
- However, after over 20 years of reporting in the medical literature about the value of HRV, the majority of cardiologists today are still uncomfortable with the mathematical presentations of Time Domain and Frequency analysis. Cardiologists in general understand that low HRV indicates poor cardiac health, and that high HRV indicates good cardiac health. However, when you ask the majority of cardiologists about the meanings of the HRV Frequency reports, you usually get a blank stare.
- There is no need to subject the majority of cardiologists to the same confusion in T-wave Alternans detection. This is especially true because T-wave Alternans is not a massive mathematical computation, as is the case with HRV.
- Regardless of the explanations, there is nothing difficult about selecting any 128 beat cluster, followed by subjecting such to many different types of detection algorithms, and then after supposedly detecting such, do the right thing, and show the cardiologist the actual ECG in a manner that can be easily be expanded in amplitude size.
- Verifying that the alternating amplitudes of the T-wave are not caused by corresponding R-wave changes or slight baseline wander should be essential to satisfying a cardiologist.
- Because of the legitimate controversy of the meaning and accuracy of reporting T-wave amplitude changes in the very small range of 1 to 20 micro-volts, DMS has focused on detecting and reporting the many T-wave Alternans found in Holter ECG recordings that exceed 20 micro-volts.
- DMS analyzes all Holter leads individually for TWA.
- When the DMS algorithm believes it detects TWA, it does not hide the actual TWA event in a mathematical presentation without actual ECG verification. Why would anyone not want to show the actual ECG upon supposed detection of TWA? Even if a detected TWA event was only of about 20 micro-volts, it is the most simple of technical tasks to expand the ECG amplitude by a factor of 10, so that the cardiologist can have confidence that a detected TWA event was not caused by very slight baseline wander or body position changes.
- DMS is not in the position of determining the diagnostic relevance of changes in T-wave amplitudes. Our position is to develop algorithms and displays that detect what appear to be T-wave amplitude changes. Then, it is our obligation to provide as much full disclosure as possible for the visual verification and validation of such, so that the physician decides about the presence or non-presence of TWA based on being led to the specific ECG event of interest.
- Perhaps the time of a transient TWA event is the time to also have the Holter system report on QTc, SAECG, HRV, QT Dispersion, and the presence of repetitive VE beats.
- The CardioScan 12 has programs for detecting and reporting on each of the above.
Criteria for TWA analysis
- TWA analysis is performed on 3-Lead and 12-Lead Holter ECG recordings.
- 2.Each lead is analyzed individually for T-wave amplitude.
- 3.Only beats that qualify for the HRV normal-to-normal (N-N) beat file are analyzed for TWA. This deletes VE, SVE, Aberrant, and Pause beats.
- 4.Only ECG leads with positive going T-waves are analyzed for TWA.
- 5.T-wave amplitude must exceed 2 mm.
- 6.All beats subject to the TWA analysis are baseline straightened prior to TWA analysis.
- 7.24-hour TWA analysis of any ECG lead is accomplished in less than ten (10) seconds.
- 8.Minimum amount of Delta T-wave change is user selected.
- 9.Minimum number of consecutive beats is user selected.
- 10.T-wave amplitudes for each analyzed beat are converted to vertical green lines in the TWA one-hour displays. The peak of each T-wave is depicted by the height of each vertical green line.
- 11.Vertical red lines indicate time periods of detected TWA. Mouse click in the red vertical line area to view, verify, and validate the TWA event.
Methodology for operating TWA program
From the Access Choices menu, select Page Scan.
After clicking on Page Scan, click on T-wave Alternans.
The below screen display will appear:
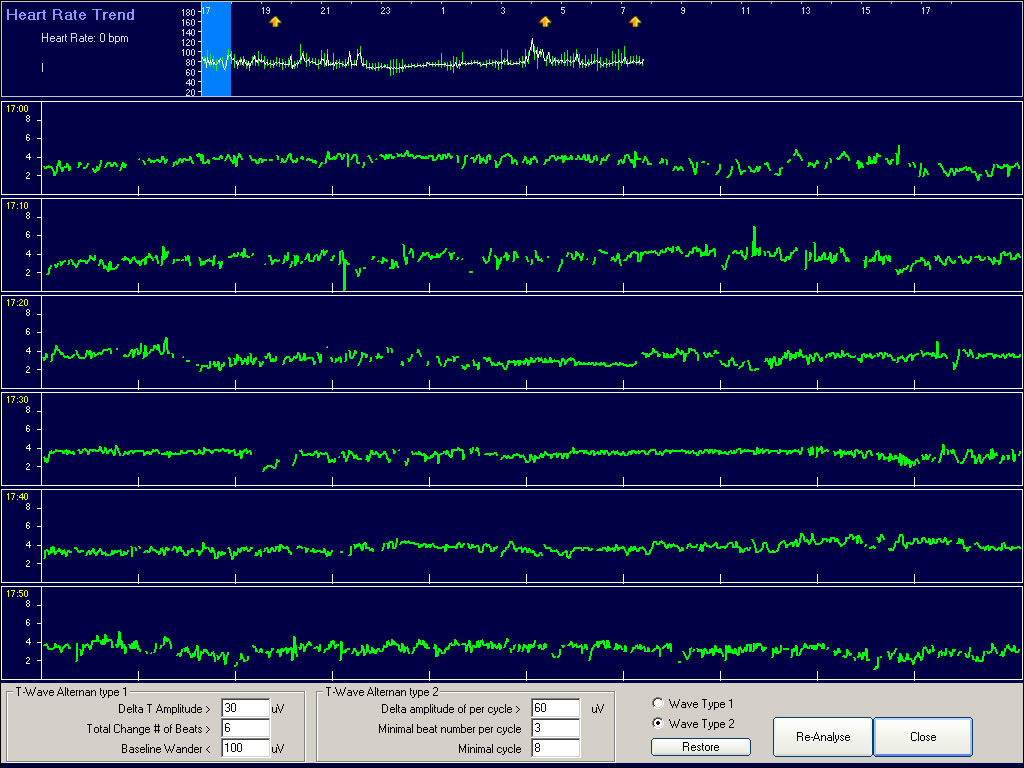
In the lower right part of display, click on Wave Type 1, and the display will change to the below.
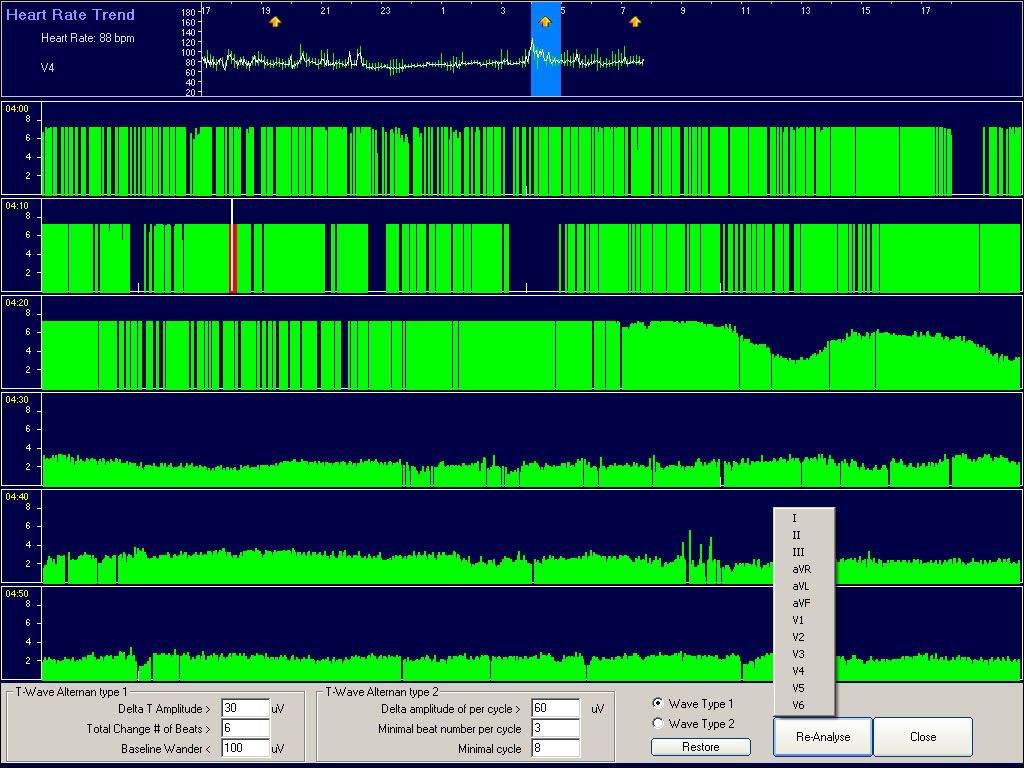
The screen display on the prior page shows a mouse click on the hour with the thick yellow arrow. The yellow area indicates a detection of TWA. The light blue color shows that this is the 4:00 hour. During this hour the red area in the second 10-minute sweep indicates TWA. At the bottom right is the “Re-Analyze” icon. When you click on this icon, any of the 12-Leads can be analyzed. V4 was selected. Double click on the red vertical line area, and the below display will appear.
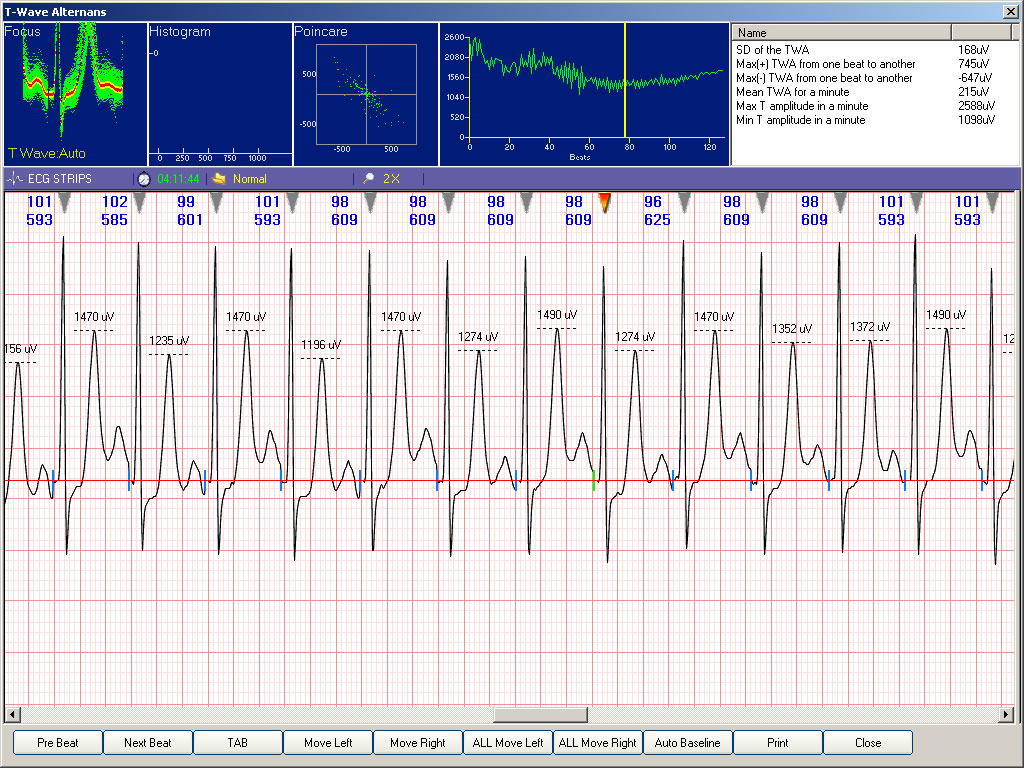
This is the TWA visual validation menu.
Move the mouse to the bright red line in the middle of the ECG strip. Drag the ECG to the desired location.
Increase the ECG amplitude by pressing the “+” key. You can increase the Gain from x2 to x10.
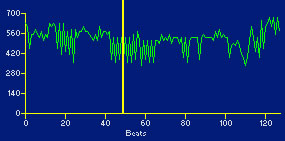
At the top middle of the display, you have the 128 beat T-wave amplitude trend. Move the long yellow cursor to a location showing up and down T-wave peaks.
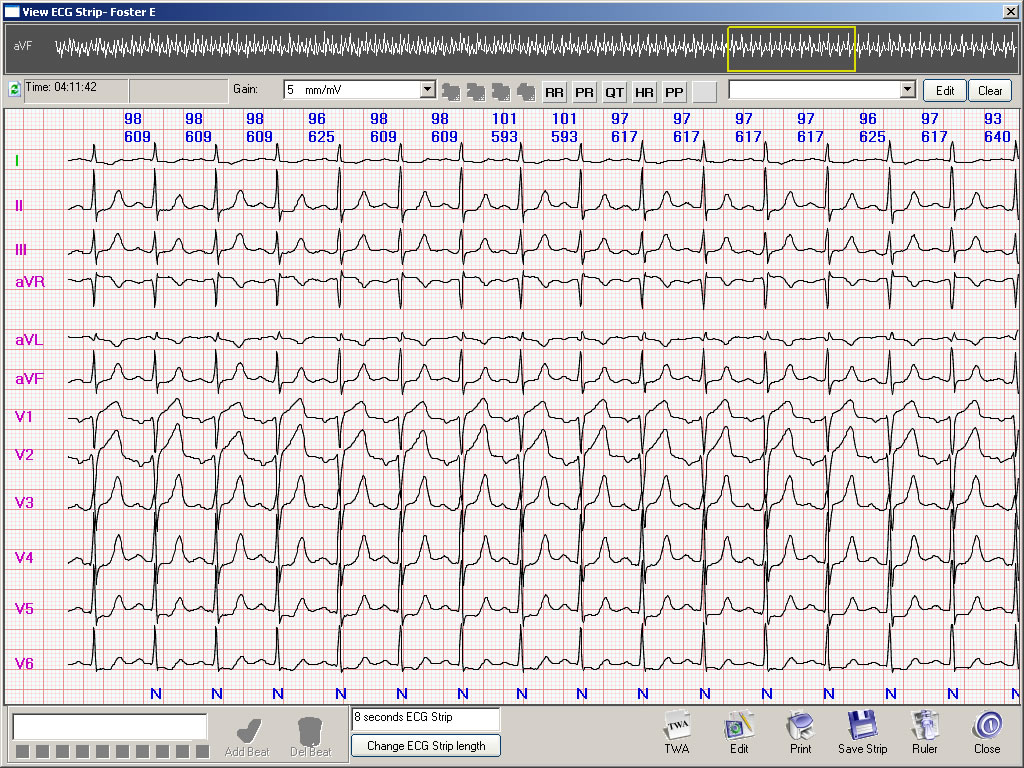
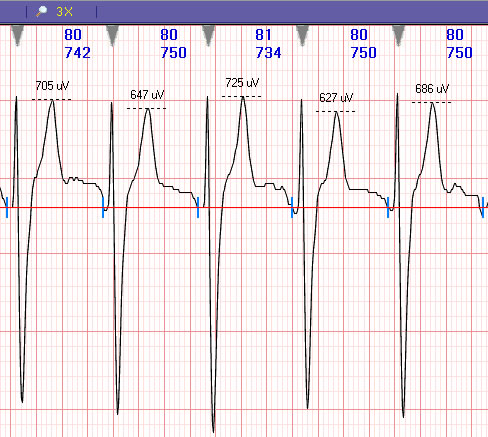
A closer look at the TWA shown for the V4 lead is displayed on the next page.
Note the steady amplitude of the R-waves and the significant changes in the T-wave amplitudes.
Also note the ST depression in this V4 lead.
The heart rate and R-R ms are shown at the top of each beat.
Note that the heart rate of the above TWA is about 100 bpm, and the TWA in the ECG in the earlier pages had a heart rate of about 60 bpm.
Rejection of TWA detection
This is an example of the T-wave alternating in its amplitude. However, note that the R-wave is also alternating in its amplitude, and the T-wave is following the R-wave peak changes. The cardiologist may want to reject this based on body position changes.