Performing the Exercise Stress Test
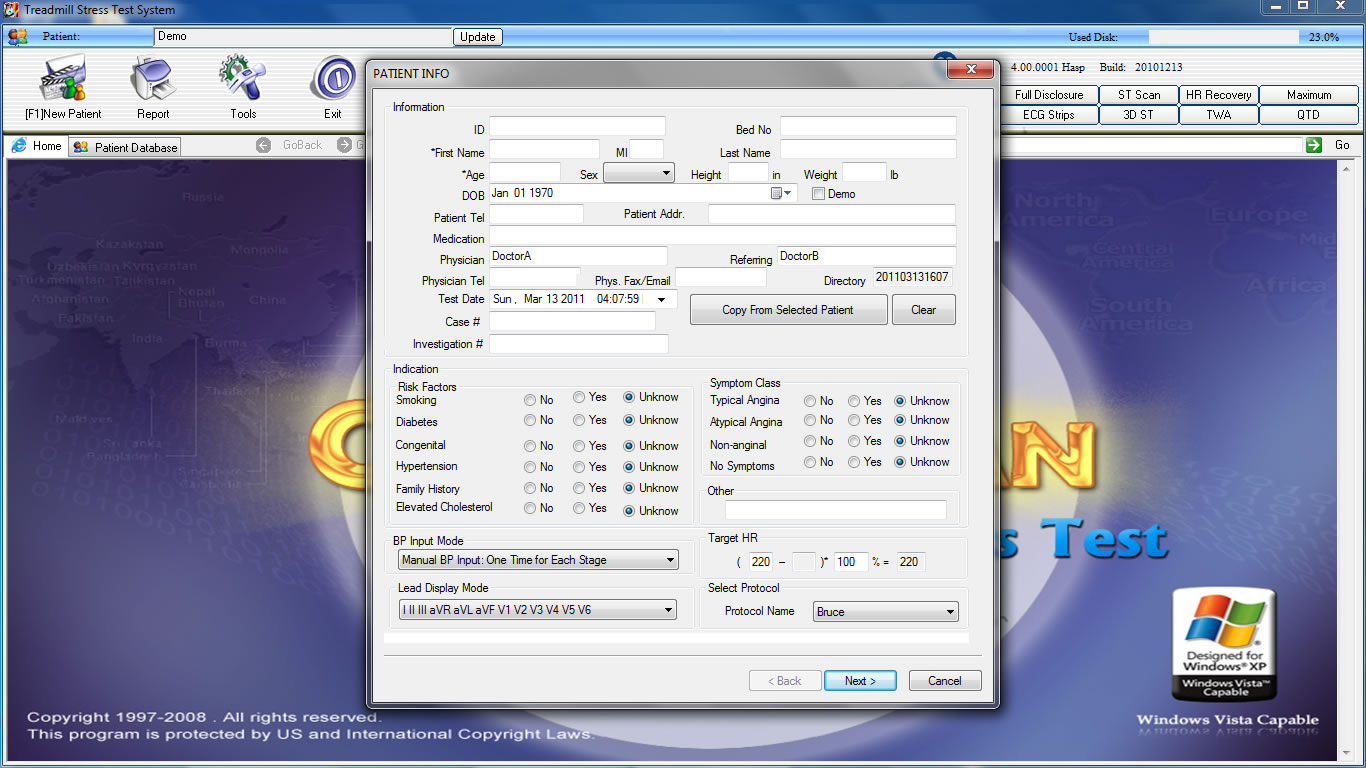
1. Click on New Patient icon shown at the top left above. You can also press the F1 key shortcut. The displayed window will appear. After inputting the desired data, click on the “Next” icon at bottom of this display. You can also import data from your existing list of patients by selecting “Copy From Selected Patient”.
2. The next display shows a typical electrode placement. Click on the “Next” icon at the bottom of the display.
3. The following display shows the ECG. The ECG will be in red (assuming you used our prior recommendations). We recommend selecting the 6-V Lead display for the test.
4. Gently tap each electrode site with your finger, and look for artifact. To test the electrode quality, you can do the following: Show the 12-Lead ECG. At the bottom right (see the screen display below) there is the “12 Mode” icon. Click on this icon. As you click on this icon, you can see the 12-Lead ECG, the 6-V Leads, the 6-Other Leads, or a 3-Lead ECG. Select the 12-Lead display and gently tap each electrode site. If you get artifact, you may want to re-clean that electrode site.
5. Click on 12 Mode icon to get the 6-V Lead display.
6. At the bottom right, there is also a Settings icon. Click on it. You may want to select the Gain at 5mm/mv. Also verify the selection of ST Point at 60 ms.
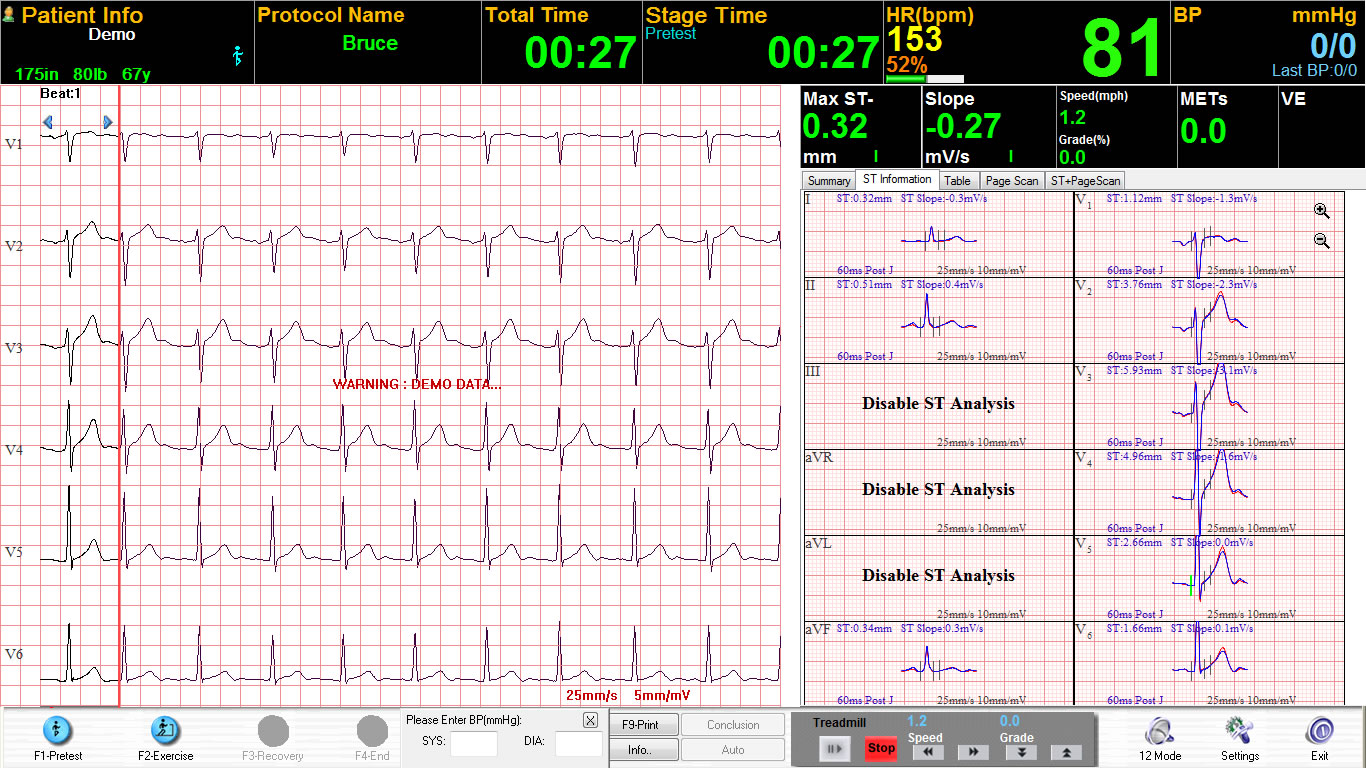
7. At bottom left, there is the icon “F1 Pretest.” Click on Pretest (note the color change in the ECG). The display below will appear. The user will have an initial option to “Disable ST Leads III, aVR, and aVL.”
8. To disable ST Analysis for Leads III, aVR, and aVL; follow these steps. There is a “ST Information” tab in the middle of the screen display below. In this screenshot, it is below the Max ST with a green color number of 0.32. Click on the ST Information icon, and the display will appear. Move your mouse arrow to the rectangular box for Lead III, do a right mouse click, and select Disable. Do the same for Leads aVR and aVL.
9. You will notice that the nine (9) active ST Leads show vertical markers for the PR baseline, the J-Point, and the ST-Point. You may want to change the location of the J-point and ST vertical markers for each patient (see next step).
10. Move the mouse arrow to the rectangular box for Lead I. Press the “Tab” key. You will notice the green vertical line for the PR baseline. Now press the “Tab” key again. You can now move the J-Point and ST-Point simultaneously by pressing either the “Home” or “End” keys. You may need to activate with the “Num Lock” key. The ST algorithm is now properly set.
11. At the top of the 12 rectangular boxes are several tabbed icons. Click on the icon on the right side that is labeled “ST-PageScan.” You are ready to begin the Stress Test.
12. At the bottom left, there is an icon that shows “F2 Exercise.” Click on this icon to begin the Stress Test. At the far left of the ECG display is the Reference ECG in black; followed by the actual real-time ECG in blue.
13. On the right side of the screen display is the enlarged superimposed ST data and the Full Disclosure. With a mouse arrow and right click, you can select any ECG Lead for ST boxes 1 & 2.
14. These two (2) enlarged ST boxes show the Reference beginning ECG with the Actual Real-Time ECG superimposed over it. This will allow you to clearly see the amount of ST Level separation, as the ST begins to depress during the Stress Test.
15. The benefit of the Full Disclosure ECG is to provide an important picture of the type and quantity of arrhythmias. With a mouse arrow and right click, you can select any ECG Lead for Full Disclosure display. Our standard recommendation is that you select V5.
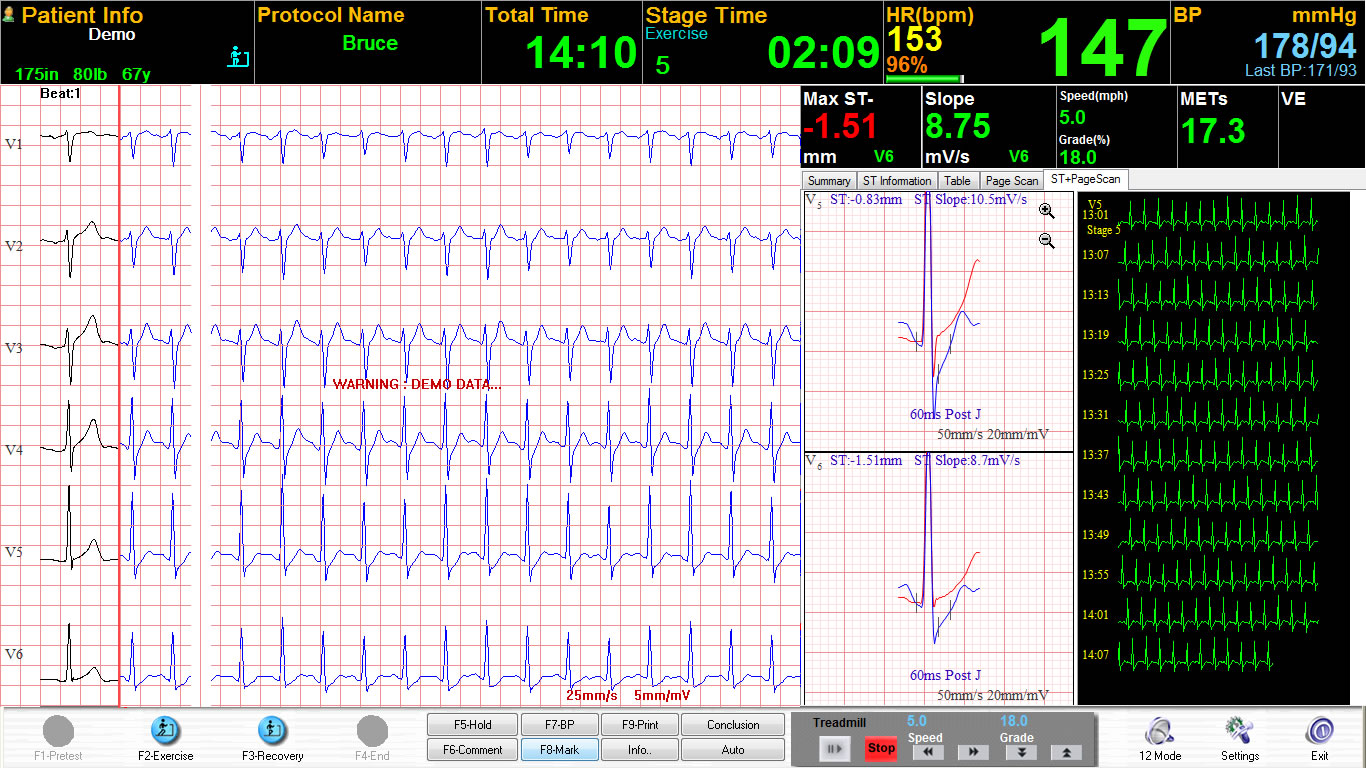
16. In following our settings recommendations, the Stress Test software will display a screen similar to what is seen below. The Reference ECG is in black and Real-Time ECG is in blue. ST changes are shown in V5 and V6. Full Disclosure shows no arrhythmias. Elapsed Time is at 14 minutes and 10 seconds in Stage 5 of Bruce. Target HR is 153 and Stage 5 heart rate is 147 at 96% of Target HR. Last BP was 178/94, and prior BP was 171/93 – showing that systolic BP is continually increasing during the Stress Test. Max ST is in V6 at upsloping -1.51mm. Treadmill is at speed of 5mph and 18% grade. METS at Stage 5 is at 17.3. Please note that this screenshot is not of a simulator ECG; but rather shows a demo patient who can exercise at high rates.
17. The Stress Test is typically ended with either the achieving of the target heart rate, or a patient problem in completing the exercise phase of the Stress Test.
18. The Recovery phase begins at the same time as the Exercise phase ends. Upon the end of Exercise, click on the “F3 Recovery” icon at the bottom left of the screen display.
19. Heart Rate and ST data continue to be analyzed during the Recovery period. Three (3) minutes is a typical time period for Recovery monitoring and analysis.
20. Quite often the Stress Test will include an Echocardiogram prior to the beginning of Exercise, and another Echo procedure at the termination of exercise. The back of the BlueTooth Receiver has two (2) outputs available for ECG data. One of these outputs can be used for the Echo.
21.When you end the Stress Test (“F4 End”), you can select (from a pop-up menu) a reason for terminating the test.
22. After the completion of the Stress Test, selecting the “HR Recovery” icon will show the following.
23. In our example, Recovery heart rate shows a cumulative 24bpm decrease for the first minute, 38bpm at the end of the second minute, and 50bpm at the end of the third minute of Recovery.
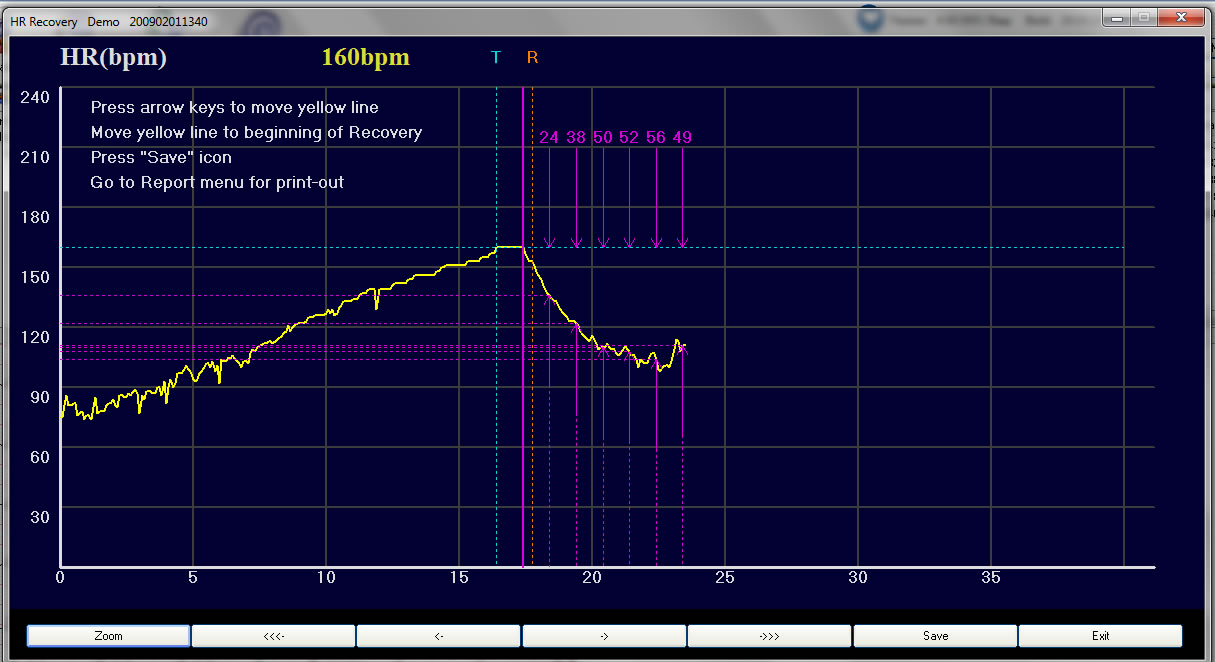
24. The above screen display can be quickly edited to ensure that the Heart Rate Recovery algorithm measures the heart rate change at exactly the time of the beginning of Recovery. Instructions are at top left of screen display.
25. To see the ST activity at the same time during Recovery, select the “Print” icon in the main menu and chose “Print HR Recovery Report”.
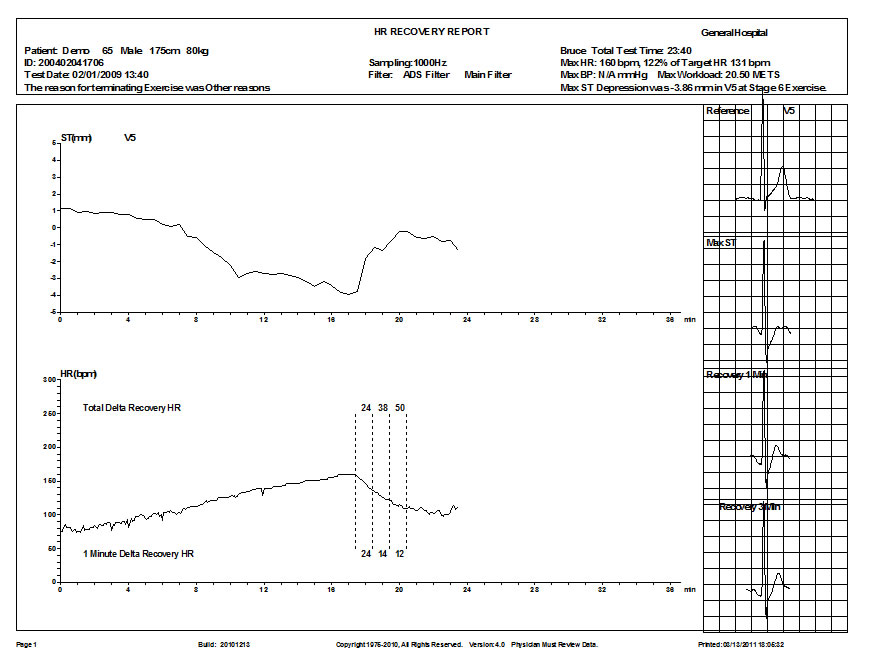
26. The ST Trend is shown, during Exercise and during Recovery, on the top portion of the report above.
27. The Heart Rate Trend is shown, during Exercise and during Recovery, on the bottom portion of the report.
28. The four (4) ECGs show (1) the Reference beginning ECG, (2) the Max ST Depression, (3) the ECG at 1-minute into Recovery, and (4) the ECG at 3-minutes into Recovery.
Derechos reservados.
Estas páginas no son un folleto de venta son explicaciones de cómo utilizar el sistema Prueba de Esfuerzo CadioScan de DMSoftware. El CardioScan cuenta con diferentes versiones y además es actualizado constantemente. El fabricante se reserva el derecho de agregar o quitar funciones. Las actualizaciones puede o no incluir las funciones de las versiones previas.
Dudas y comentarios alfonso@nafarrate.com